In our previous article, we learned that data were primarily divided into two main types: categorical and numerical data. However, we also learned that categorical data can be further subdivided into nominal and ordinal data. In addition, numerical data can be further subdivided into interval and ratio data. Let’s learn about each of these four types of data that we encounter in data science.
Nominal data are a type of categorical data. That is, they are used to represent named qualities. However, nominal data have no natural rank order to them (they differ by their name only).
For example, the colors red, green, and yellow all describe the color of apples. However, no one color is greater than or less than another color.
These three colors have no natural rank order to them. They differ by their name alone.
Other examples of nominal data include: your name, your credit card number, and the name of the city where you were born. The key distinction is that nominal values have no natural order to them. However, they can still be sorted alphabetically.
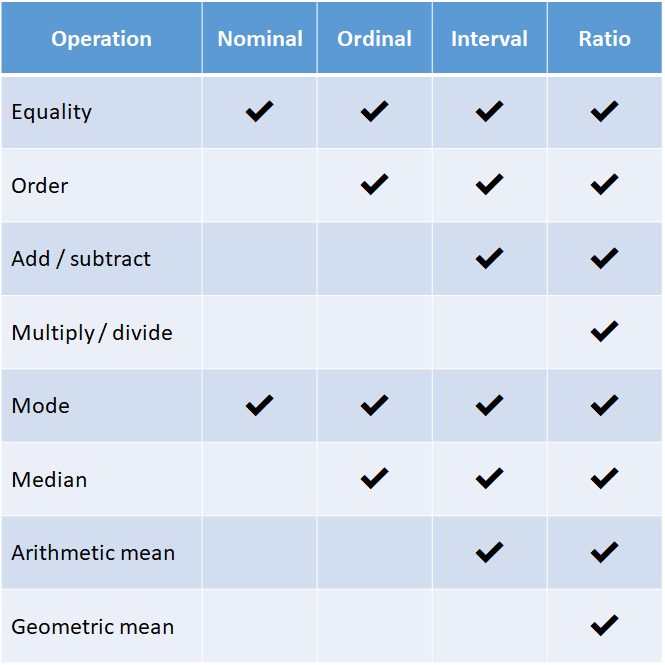
There are a limited number of mathematical operations that we can perform on nominal data. We can test two nominal values for equality (i.e. we can determine if they are the same named category). In addition, we can determine their mode (i.e. we can get the most frequently occurring category in a set of nominal values).
Ordinal data are a type of categorical data. That is, they describe named qualities of things. However, ordinal data do have a natural rank order to them. So they can be sorted in order by their rank.
For example, we could group apples into small, medium, and large sizes. Medium apples are larger than small apples, and large apples are larger than medium apples, so they do have a natural rank order.
Other examples of ordinal data include: bronze, silver, and gold medals in the Olympics, assigning letter grades for student test scores, and low, medium, and high speeds on a portable fan. The key distinction is that ordinal values do have a natural order to them, so we can sort them in a natural way.
We can perform a few more mathematical operations on ordinal data than on nominal data. In addition to testing for both equality and determining the mode. We can also test two ordinal values for their order (by determining if one value is ranked greater than or less than another). In addition, we can determine the median (i.e. the middle most value in a list of sorted values).
Interval data are a type of numerical data. That is, they represent measured quantities of things. Interval data allow for a degree of difference between two values (i.e. we can add or subtract the values in meaningful ways).
However, interval scales have an arbitrary zero point on their scale
(i.e. the place were zero appears on the scale was chosen for convenience not because it represents a true absence of the thing being measured. So there is no concept of a ratio between two numbers or the ability to multiply or divide two numbers in any meaningful way.
For example, imagine a thermometer measuring outdoor temperature. The zero point on a Celsius thermometer represents the temperature where water freezes. This is simply for convenience zero on this scale does not represent absolute zero heat, as it does on the Kelvin scale. The difference between 20°C and 30°C (which is a 10° change) is the same difference in temperature as a change from 40° to 50° (also a 10° change). So we can perform addition and subtraction with this interval scale.
However, it doesn’t make sense to say that 20°C is half as hot as 40°C or that 40°C is twice as hot as 20°C. This is because 0°C isn’t the absence of all heat but rather was an arbitrarily chosen point on the scale where water freezes. So it simply doesn’t make sense to discuss ratios, multiplication, or division with the Celsius temperature scale or other interval scales.
Other examples of interval data include: IQ scores, dates on a calendar, and longitudes on a map. The key distinction is that the zero point on an interval scale is arbitrarily chosen; it doesn’t represent a natural minimum quantity of the thing being measured.
We can perform a few more mathematical operations on interval data than we can on nominal and ordinal data. In addition to testing for equality, sorting by order, and determining both the mode and the median. We can also add or subtract interval data. In addition, we can also determine the arithmetic mean (i.e. average value in a set of interval values).
Ratio data are a type of numerical data. That is, they represent measured quantities of things. Ratio data allow for a degree of difference between two values, just like interval data.
However, unlike interval data, ratio scales do have a natural (non-arbitrarily chosen) zero point. So the concept of a ratio, and multiplying or dividing two values make perfect sense.
For example, imagine we have two apples: One has a mass of 100 grams and the other has a mass of 200 grams. Unlike an interval scale, it make perfect sense to say that a 100-gram apple is half the mass of a 200-gram apple. This is because zero grams on this scale represents a natural minimum quantity (i.e. no mass at all). So 200 grams of mass is twice as much mass as 100 grams of mass.
Other examples of ratio data include: the distance between two points, income from your job, and elapsed time. The key distinction (once again) between interval and ratio scales is that the zero point on a ratio scale represents a natural zero quantity of the thing being measured.
It can be difficult to recognize the subtle yet important difference between interval scales and ratio scales. So if you’re having difficulty understanding, you may want to research this topic further.
We can perform a few more mathematical operations on ratio data than we can on nominal, ordinal, and interval data. In addition to all of the operations we’ve seen so far, we can also multiply and divide ratio data. In addition, we can determine the geometric mean, which is a method of averaging used for values with widely varying ranges.
To learn more about the types of data in data science, please see my latest course Intro to Data for Data Science.